Software
Aaronia`s RTSA Suite PRO software comes from years of experience and innovation in the fields of RF and spectral analysis. Despite its technical capabilities, Aaronia has created a software that is easy to use, allowing for users not experienced in using this type of software to operate it with minimal difficulty.
The RTSA-Suite PRO is a powerful real-time spectrum analysis software that enables the integration of various hardware components, allowing the AARTOS™ system to be modularly designed and controlled. The simple ‘block’ configuration of the software is optimal for drone detection, especially in the industries where the AARTOS™ system is intended to be used.
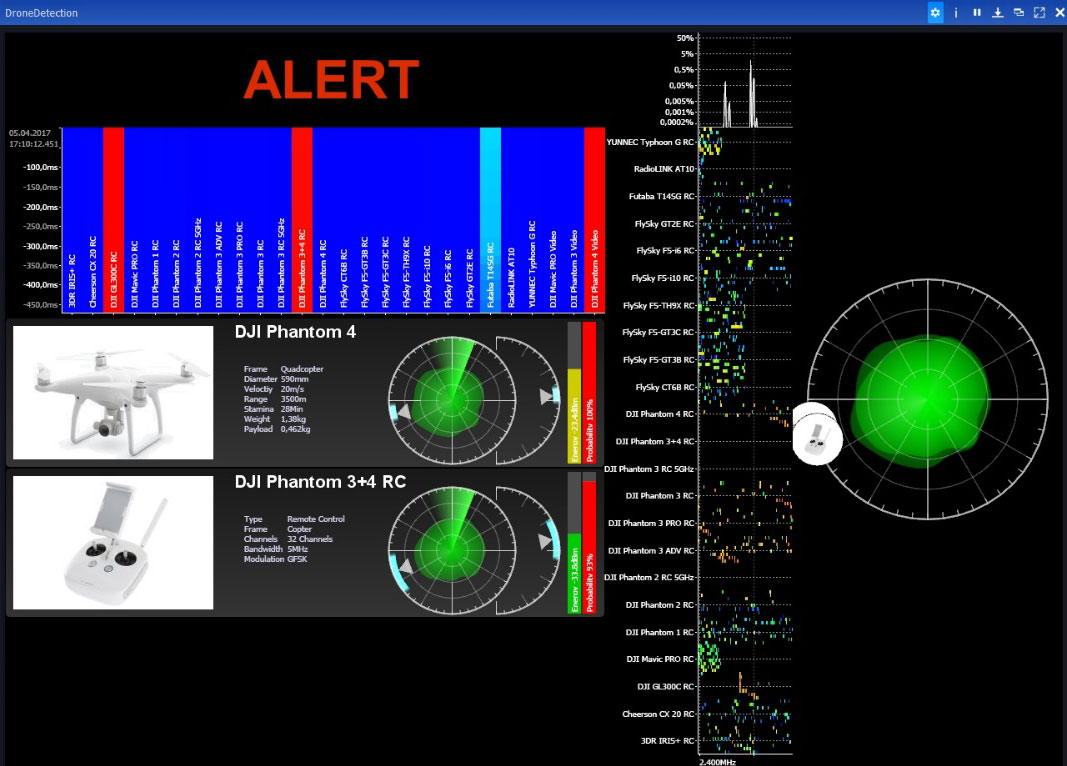
Our easy-to-use tactical display controls and visualizes all integrated components and sensors (RF detector, radar, cameras (PTZ), jammers, etc.). It offers maximum flexibility and detailed information that is second to none, including: multiple graduated alarm zones, simultaneous display of all drones and remote controls, automatic classification of all targets, optical target verification and tracking, real-time recording of all raw data including IQ and video. It also provides a simultaneous 2D and 3D view, topographic terrain structures with complex 3D models of the areas to be secured (airports, cities, industrial plants). The capabilities are just some of the highlights of this world-class software.
In addition, the control of the effectors gives the ability to force drones to land automatically or manually sent back to the operator at any time (smart jamming). The system is rounded off by an app that gives an overview of the current status and can even give control of the entire system to the user.
AI-Enabled Camera Tracking
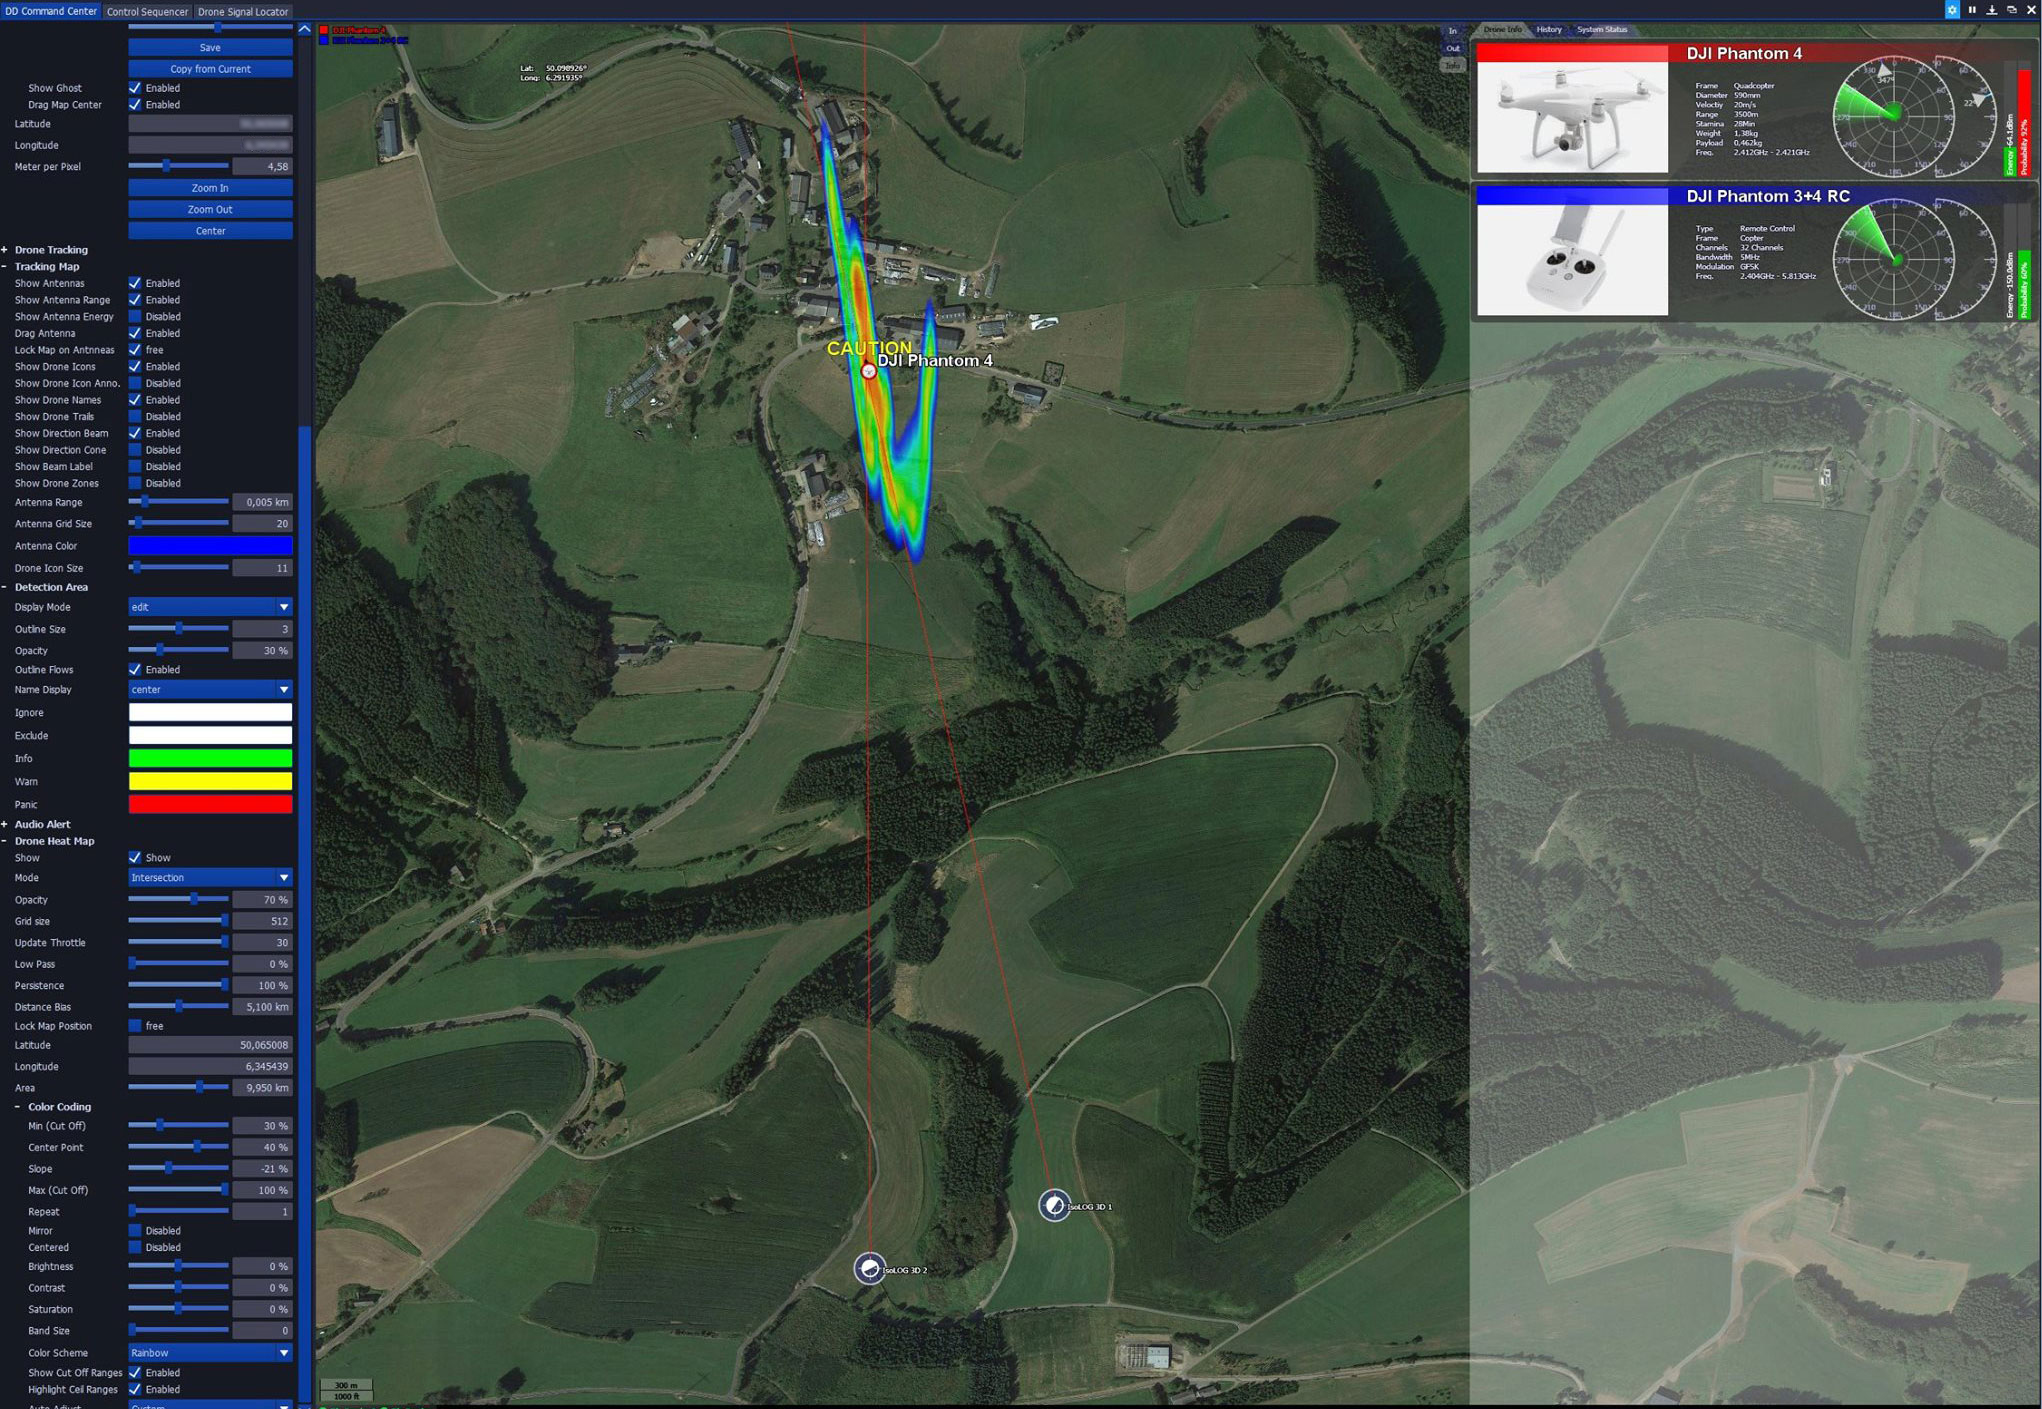
A highlight of our software is the optical target tracking via PTZ camera(s). The integrated AI-based real-time target recognition allows several targets to be tracked simultaneously. A unique feature is our optical triangulation, which can calculate the exact GPS position of a target with the help of several cameras.
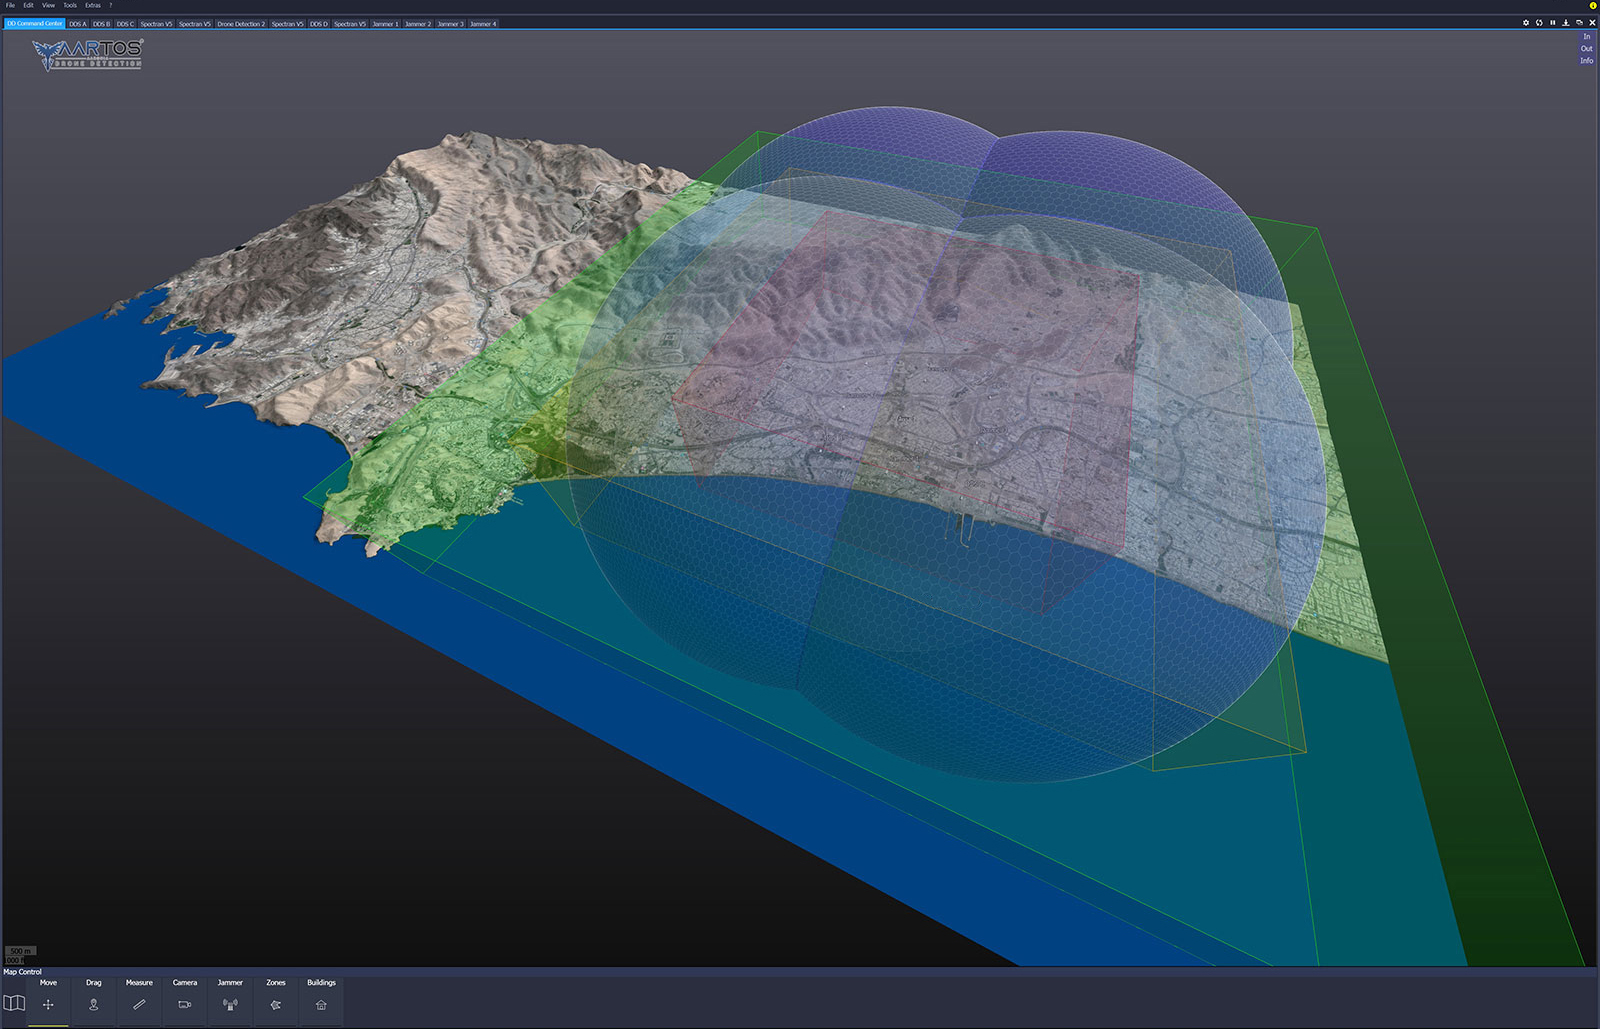
Jammer Setups (including dispersion diagrams)
Our jammers can be easily integrated into the AARTOS™ system. Each antenna, or sector of the jammer, can be assigned an individual propagation diagram. These “cones” can be defined both two-dimensionally and three-dimensionally in length, width, height and color. When the jammer is activated, the corresponding cone/sector is animated. Enabling the best possible visualization on the tactical display.
Multi-Frequency 3D Direction Finding
Our (optional) Direction Finding Block (DF) allows you to find the direction of an unlimited number of sources simultaneously, even those at different frequencies. This feature is a WORLD FIRST and is made possible by our new V6 receiver. Additionally the elevation of the target can be displayed, made possible by our unique IsoLOG 3D DF antenna.
Deep Learning KI Target Classification
Our unique AI-based algorithm for signal recognition enables virtually error-free pattern recognition even in an urban environment (city, trade fair, event) with maximum radio traffic load. This is the only way to make the use of our AARTOS™ possible in these environments.
Simple Configuration
RTSA Suite Pro can be intuitively configured to connect a wide variety of hardware, and offers customizable settings/views according to your needs. The ability to program your own blocks allows the system to be used for large installations with hundreds of sensors and effectors (monitoring of entire cities, border installations or even nationwide installations).
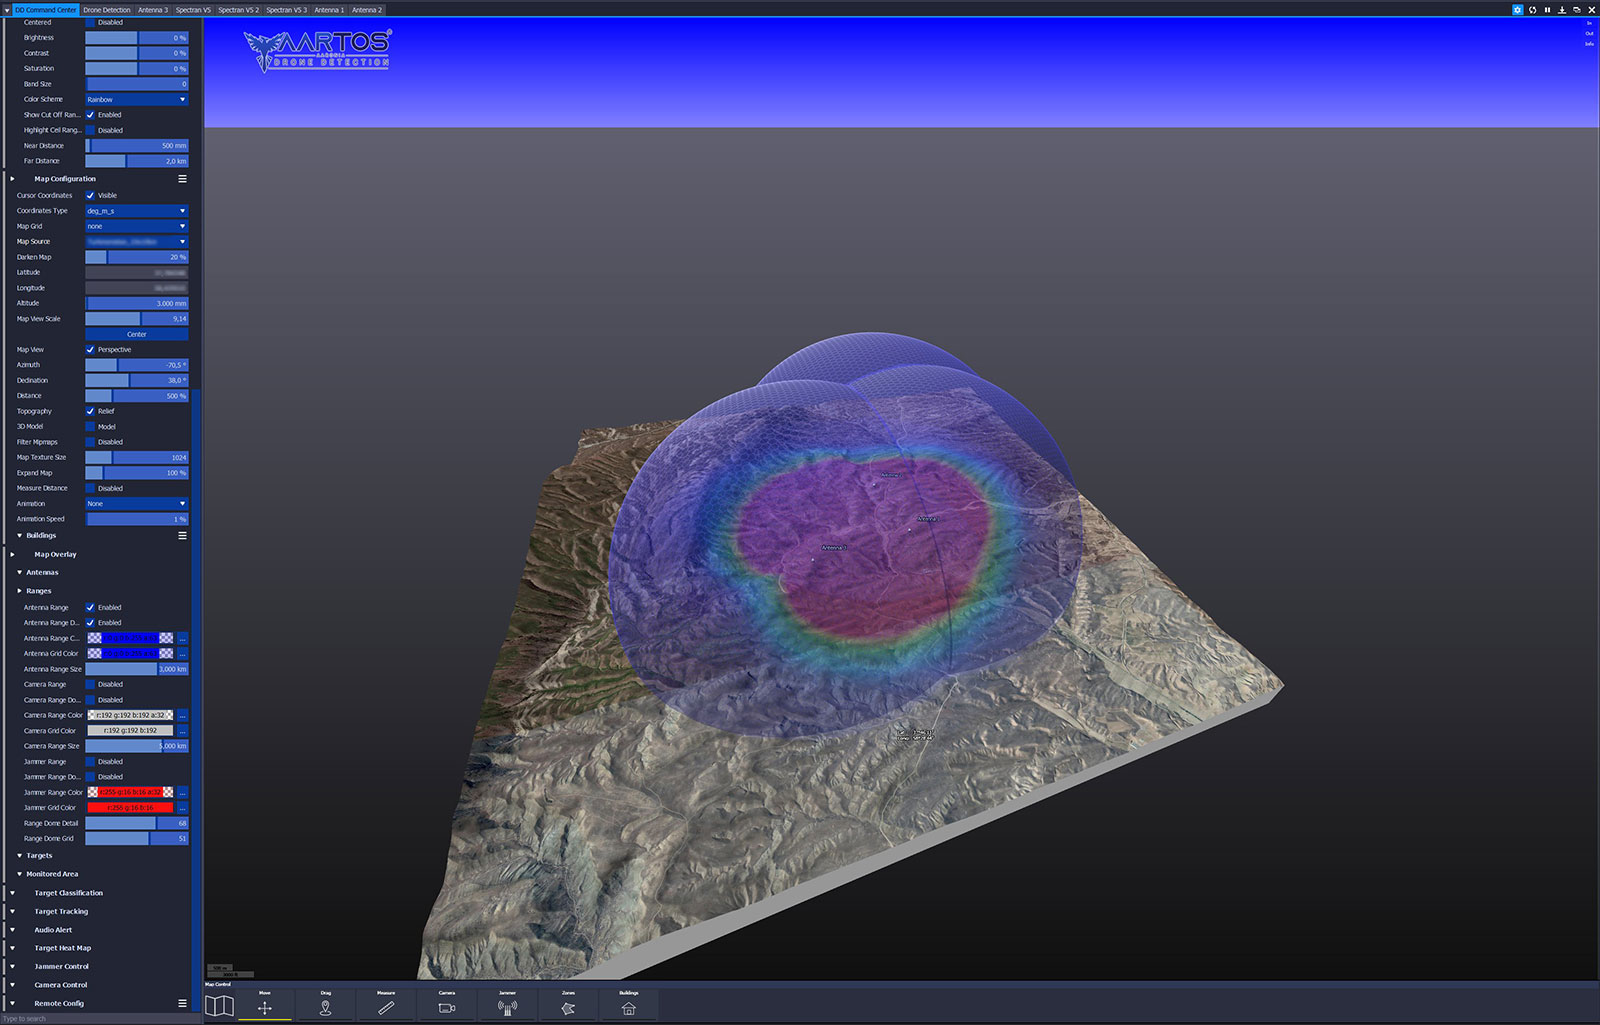
3D Position Accuracy Display
This three-dimensional representation enables a better visualization of the true system coverage. In addition, the range of the individual sensors can also be displayed as transparent spherical network structures, resulting in a perfect overall picture of the system performance.
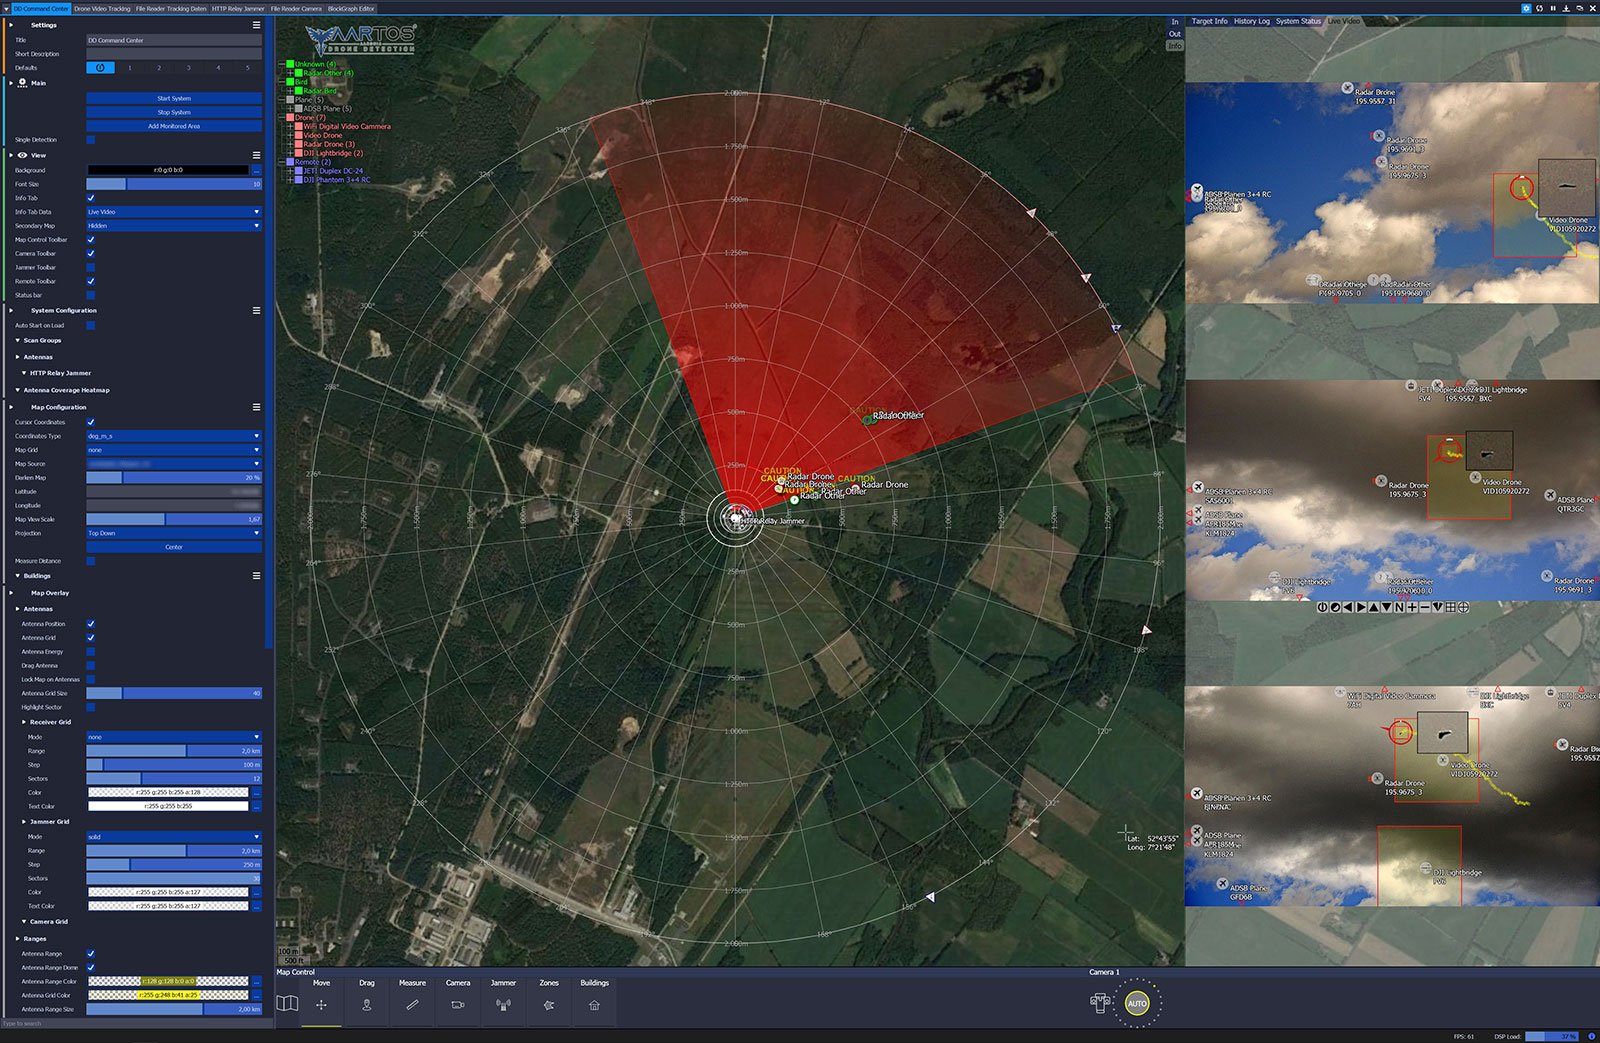
Alarm Zones
User configuration of alarm zones in any shape and height or color allows you to automatically protect certain areas from drone activity. If a drone enters such a zone, an alarm is automatically triggered or an effector (jammer) is activated. In addition, each alarm zone can be assigned its own alarm gradation. For example, in some zones only one registration can take place while in other, very critical, zones a correspondingly higher alarm level is reported.
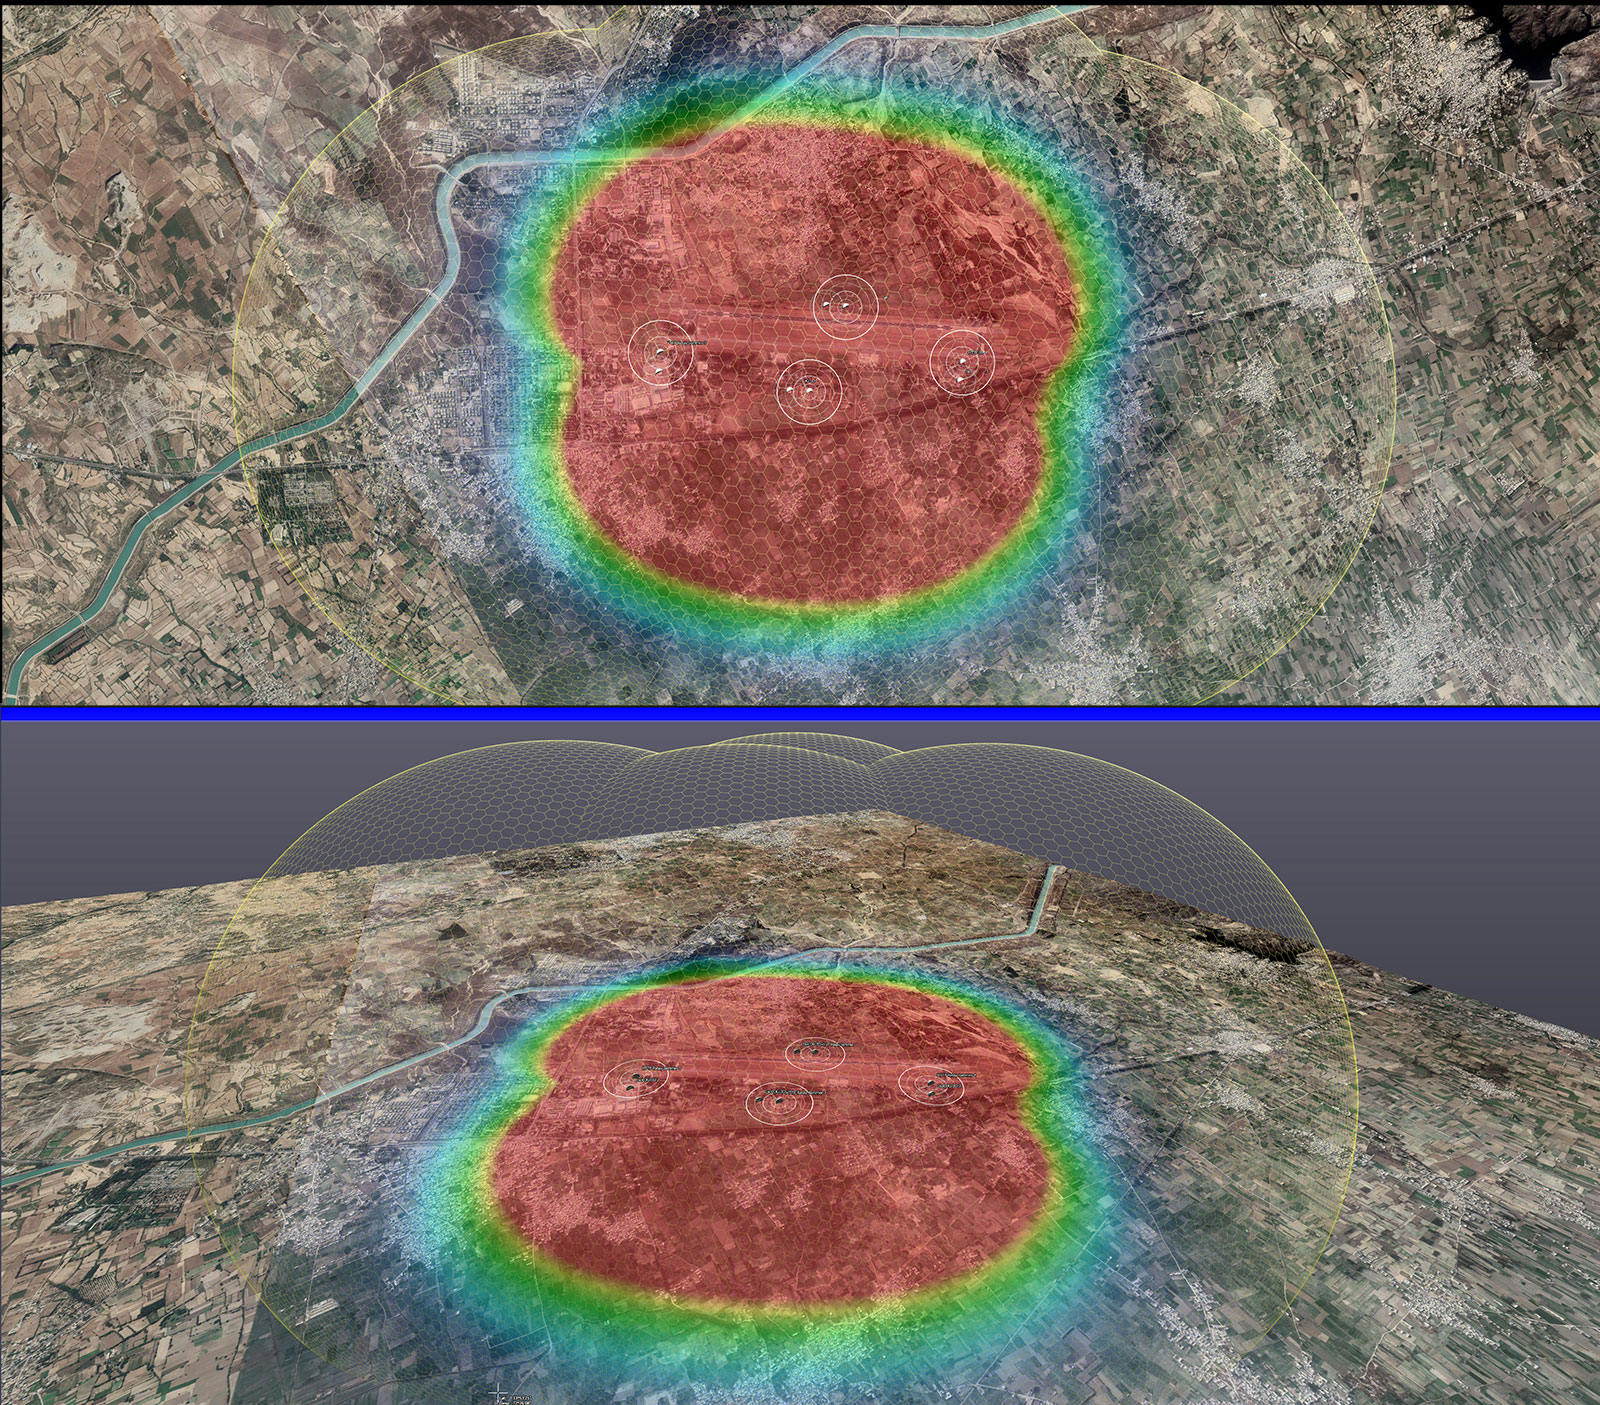
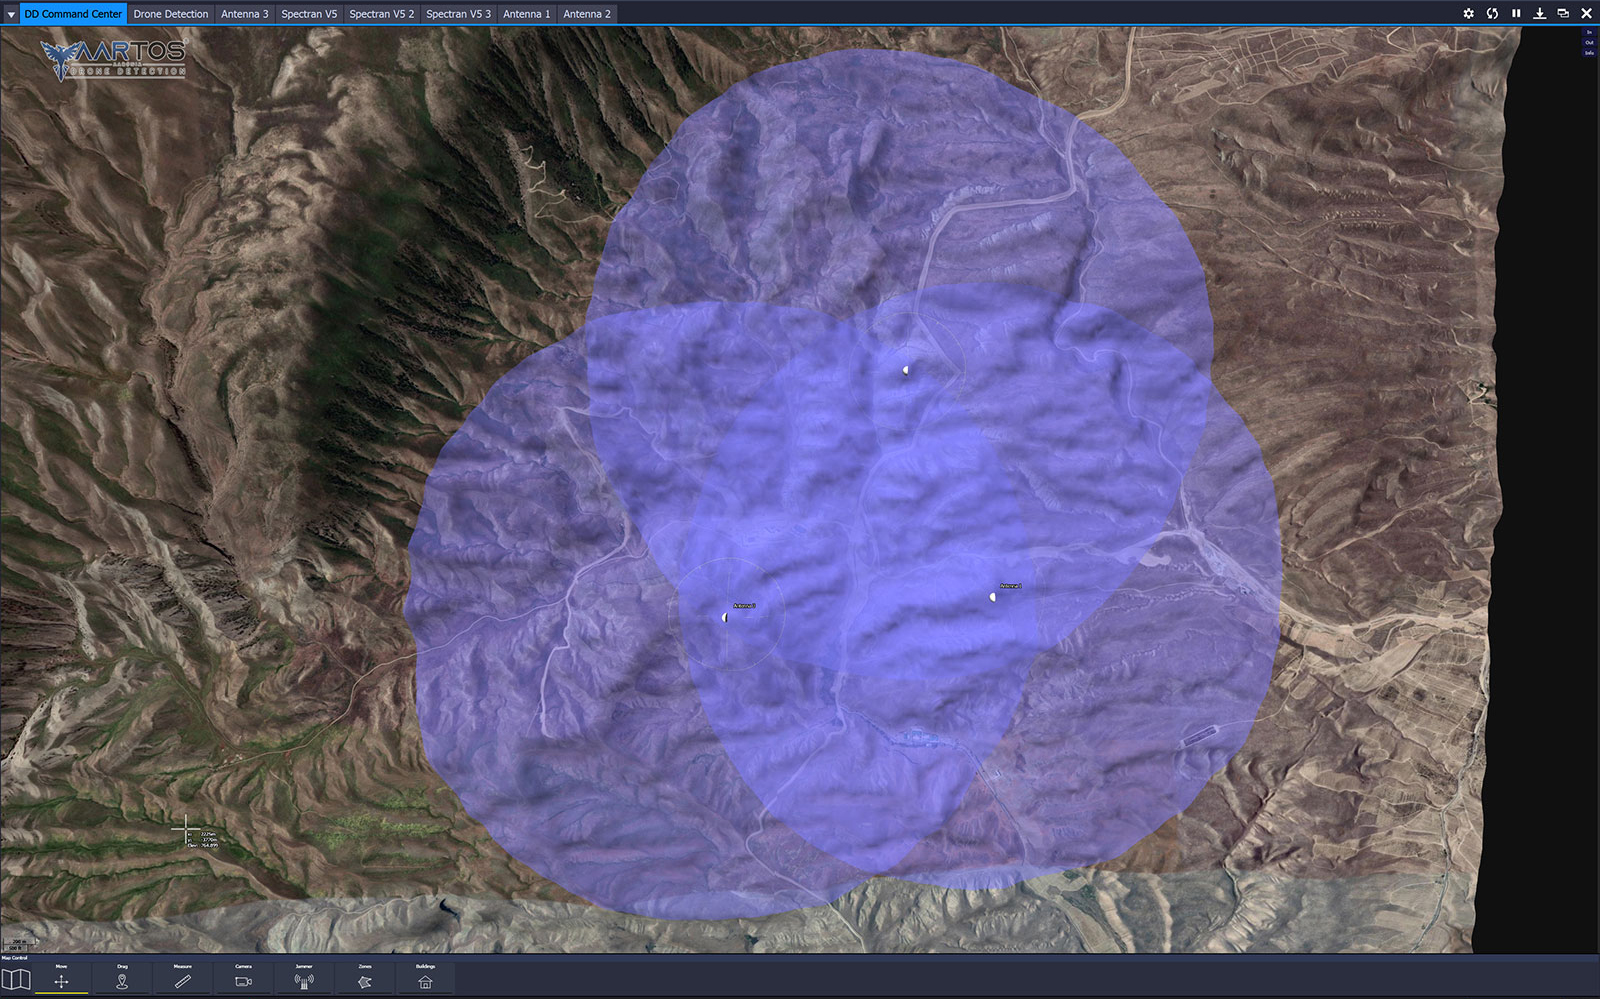
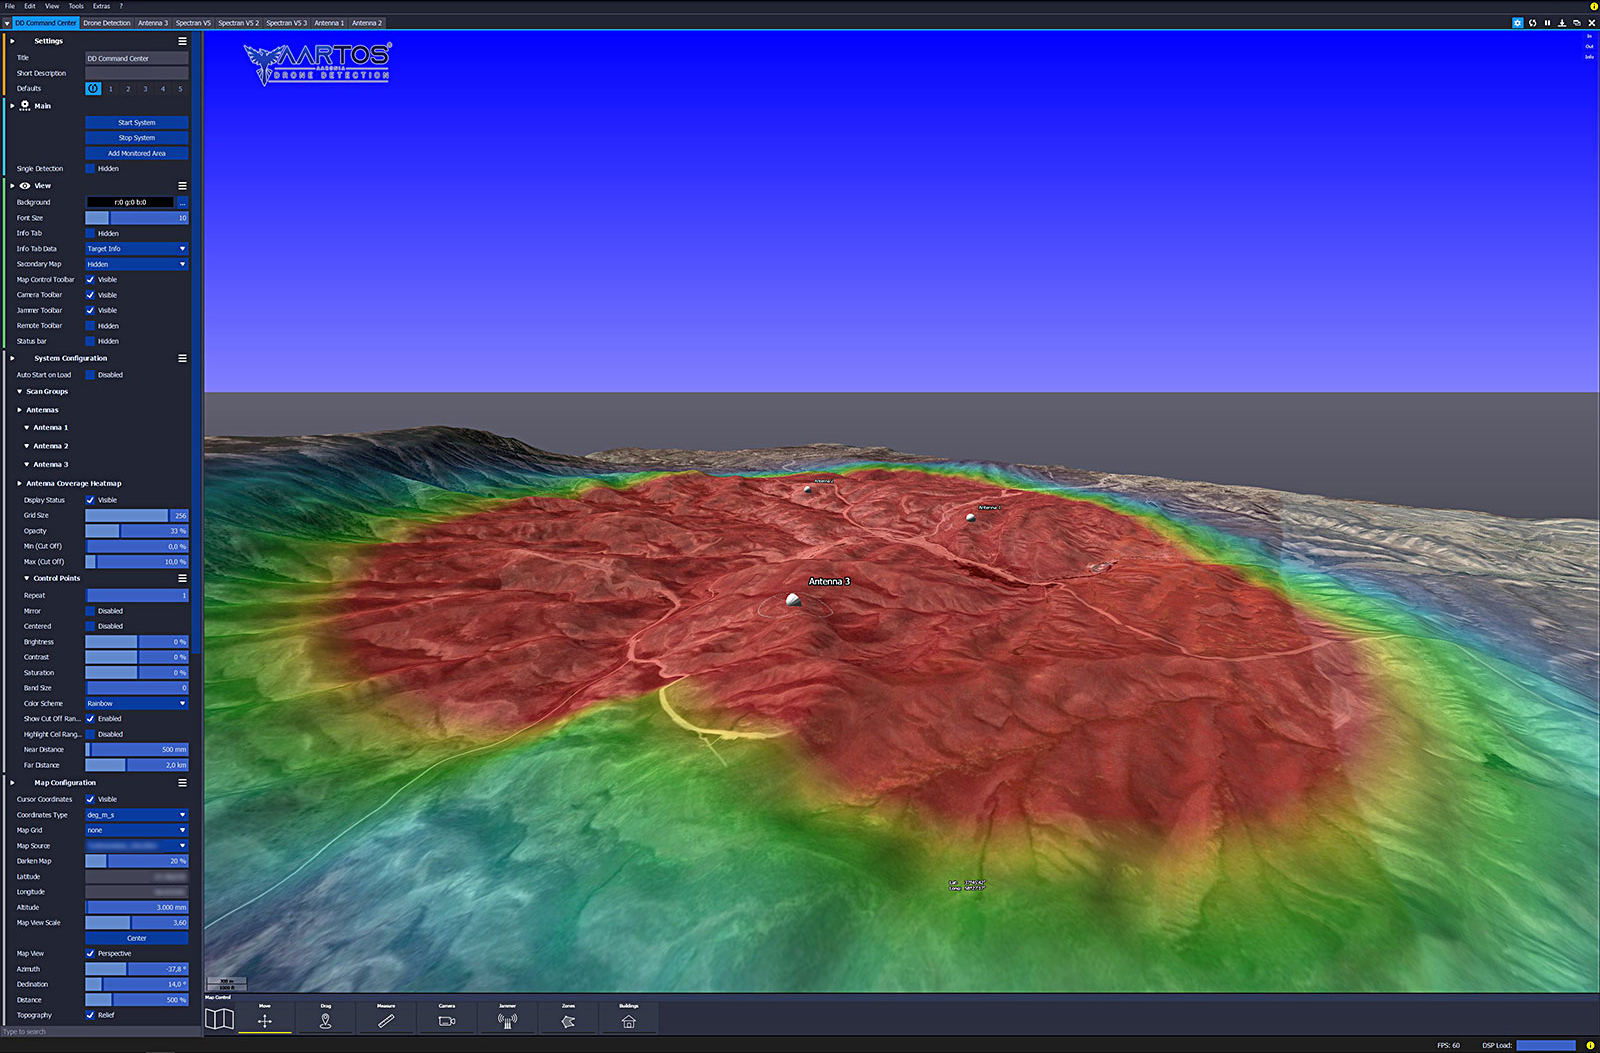
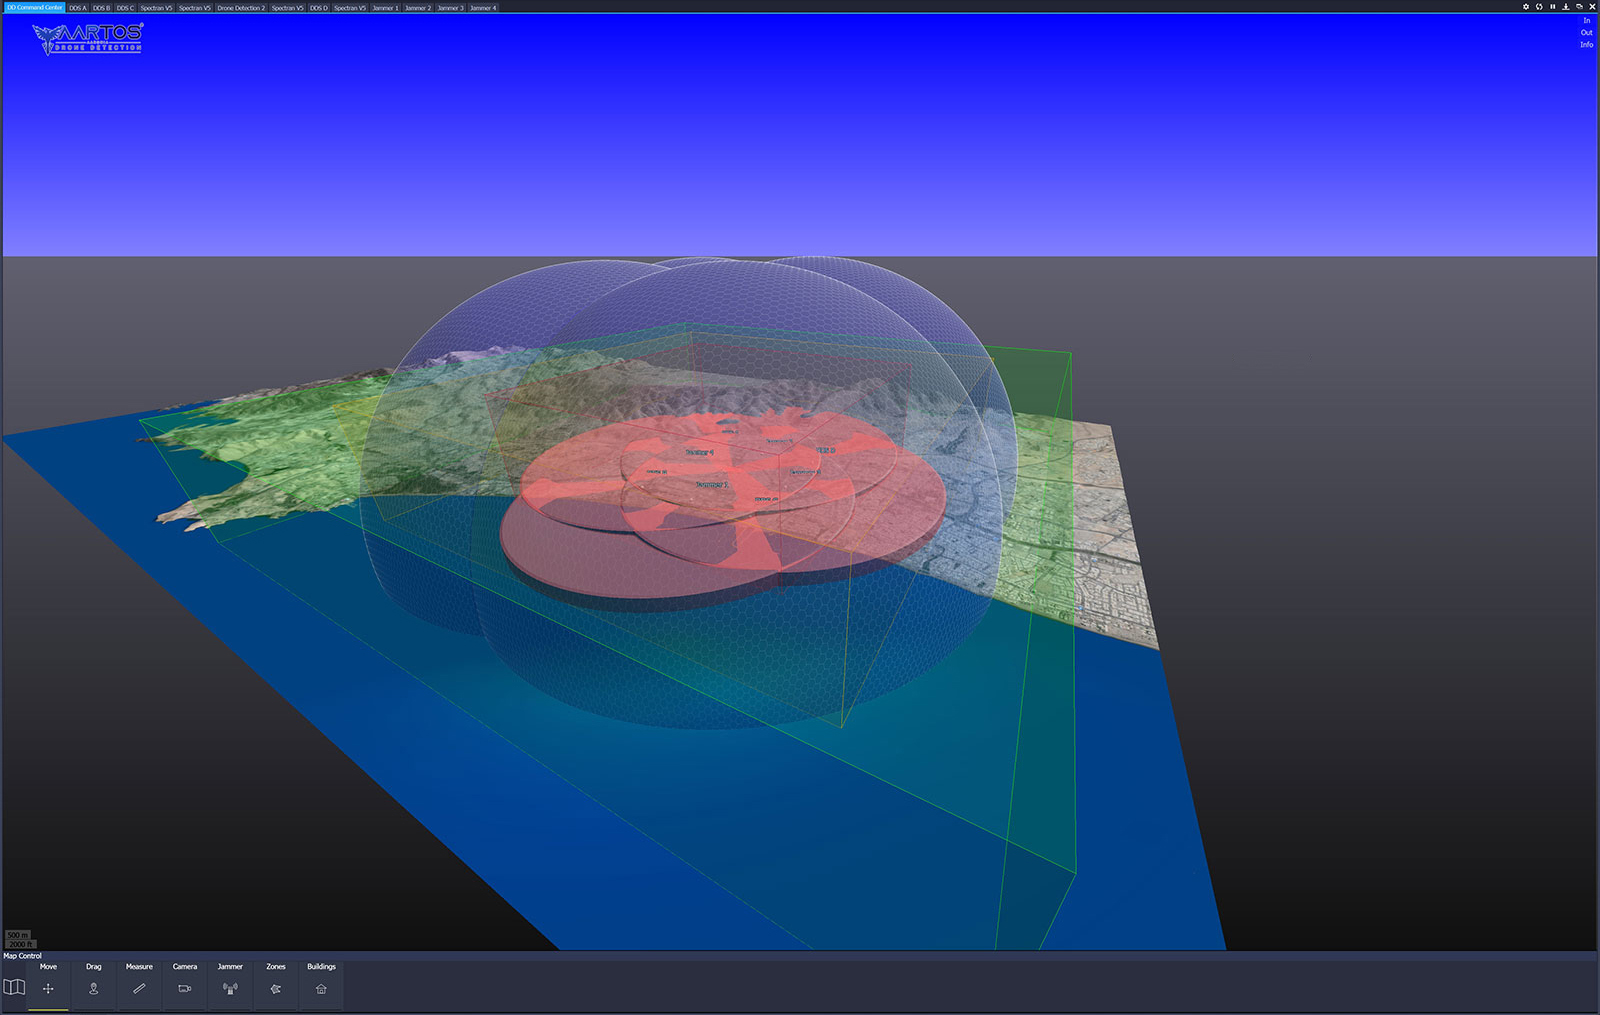
Radar Coverage
The visualization of the radar coverage is an important part of the system design, because the radar can never reach the performance of the RF detector, because especially the elevation is usually very limited. The graphical view demonstrates this impressively and helps the customer to better understand the advantages and disadvantages of a radar. Here is an example of four overlapping 360° radars.
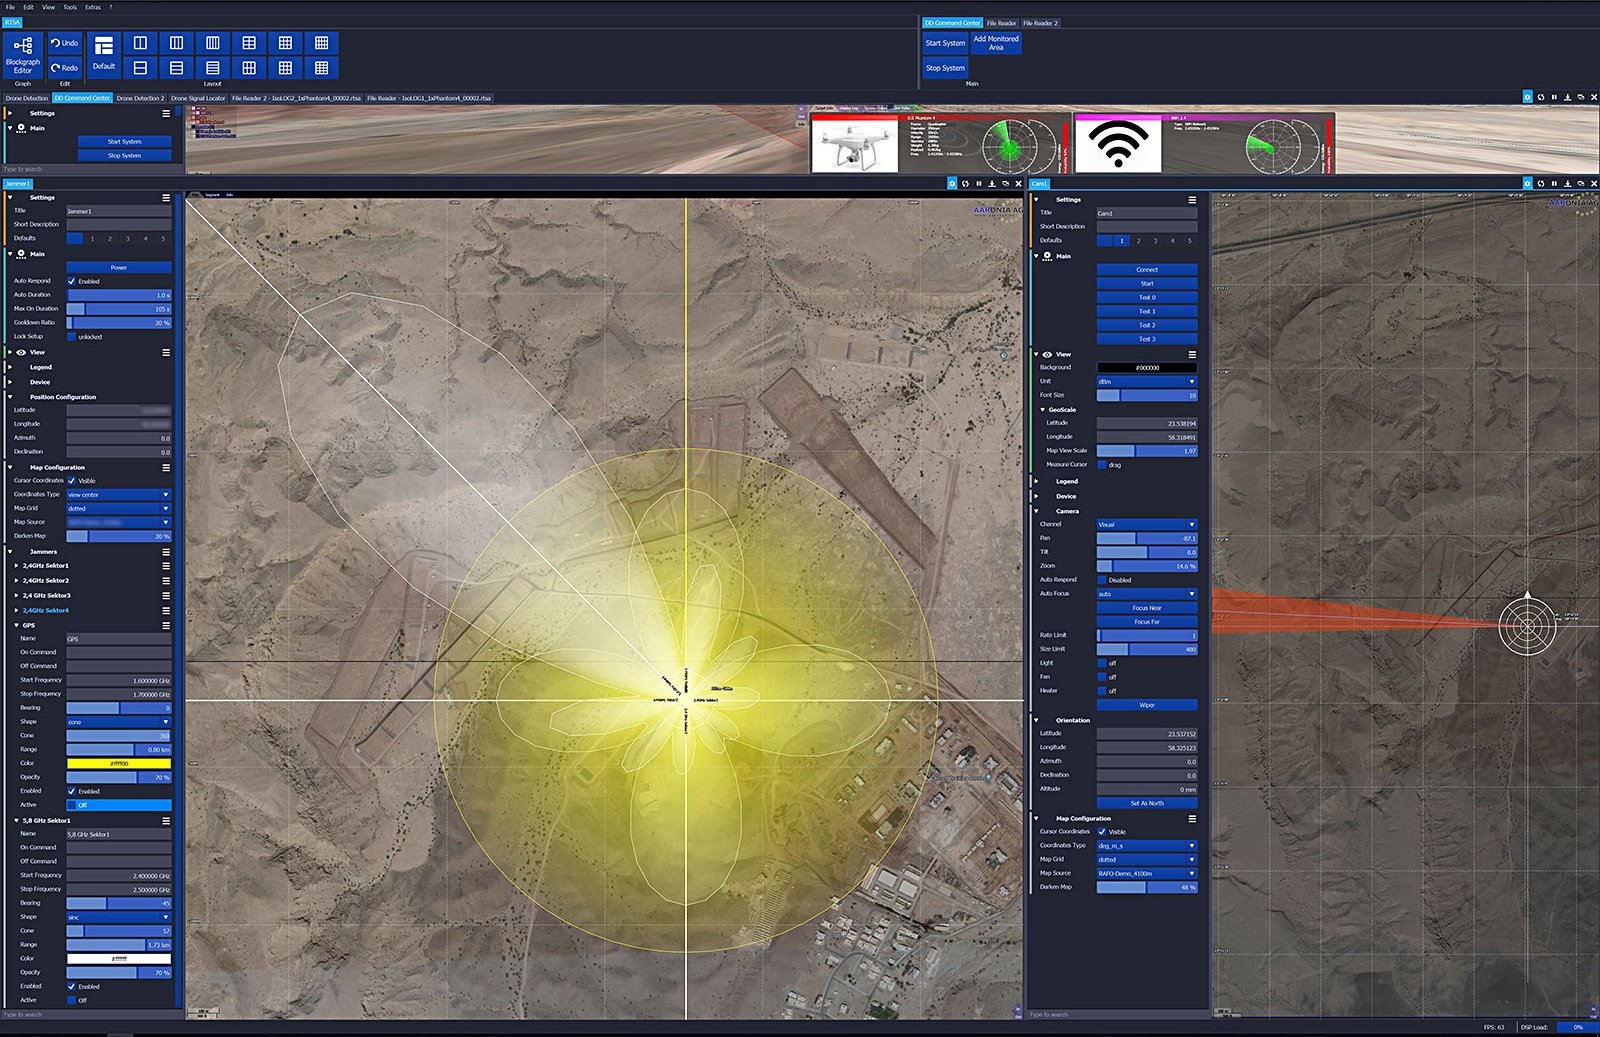
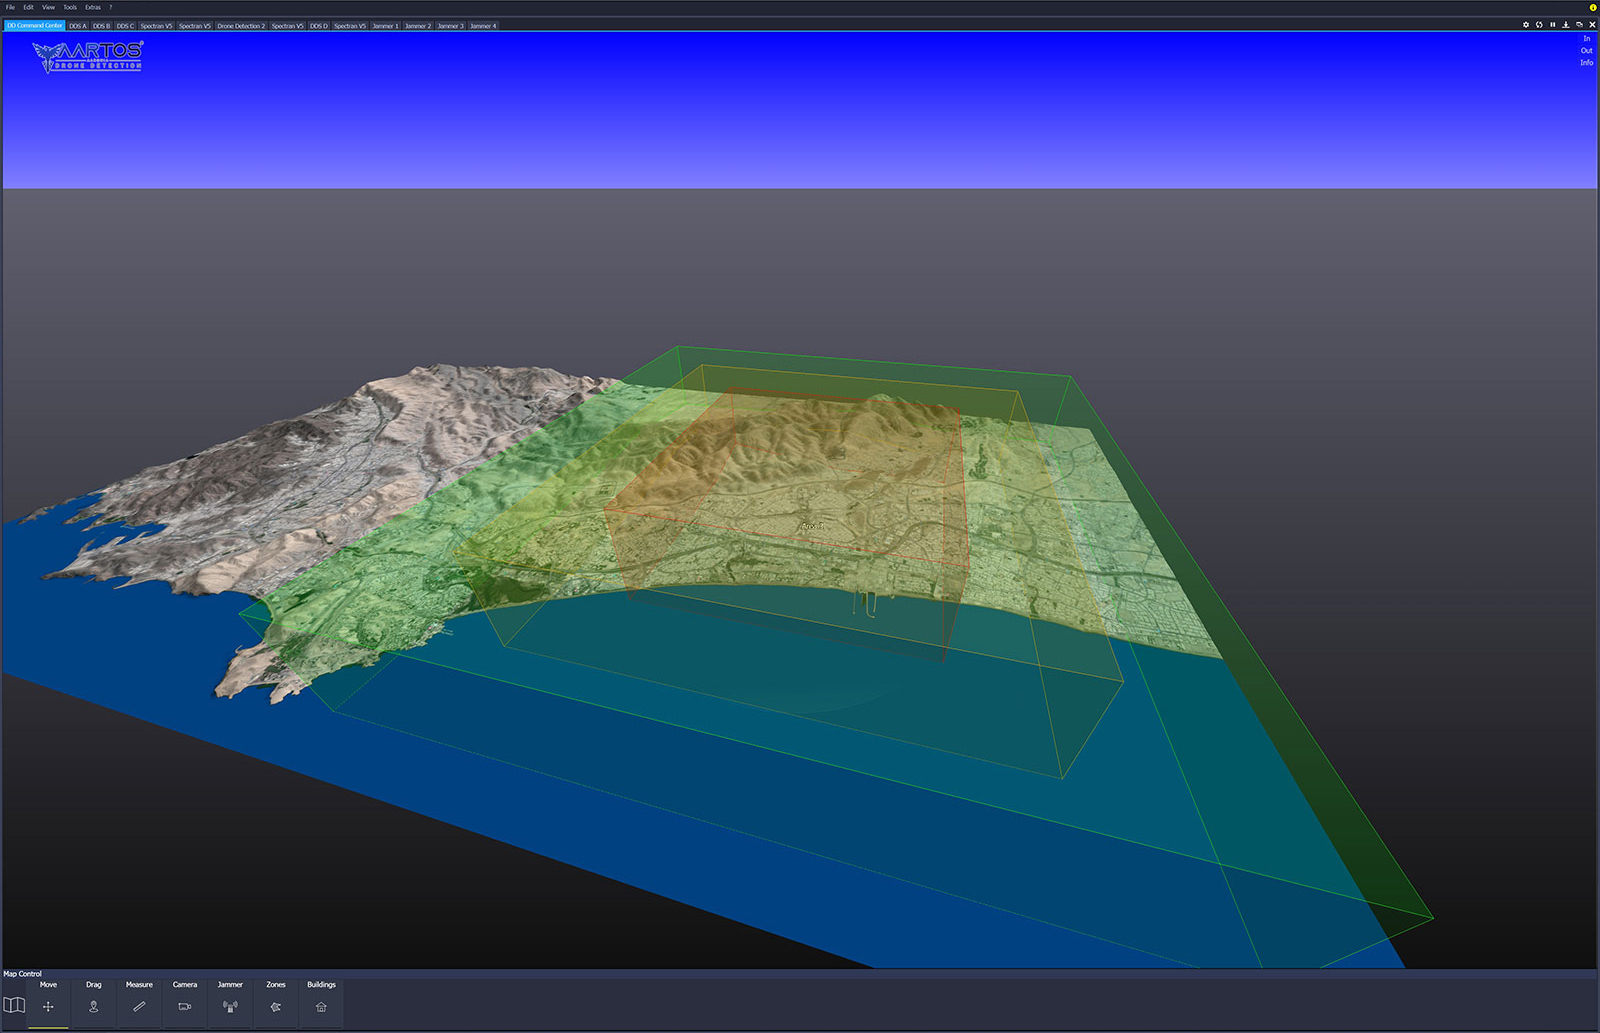
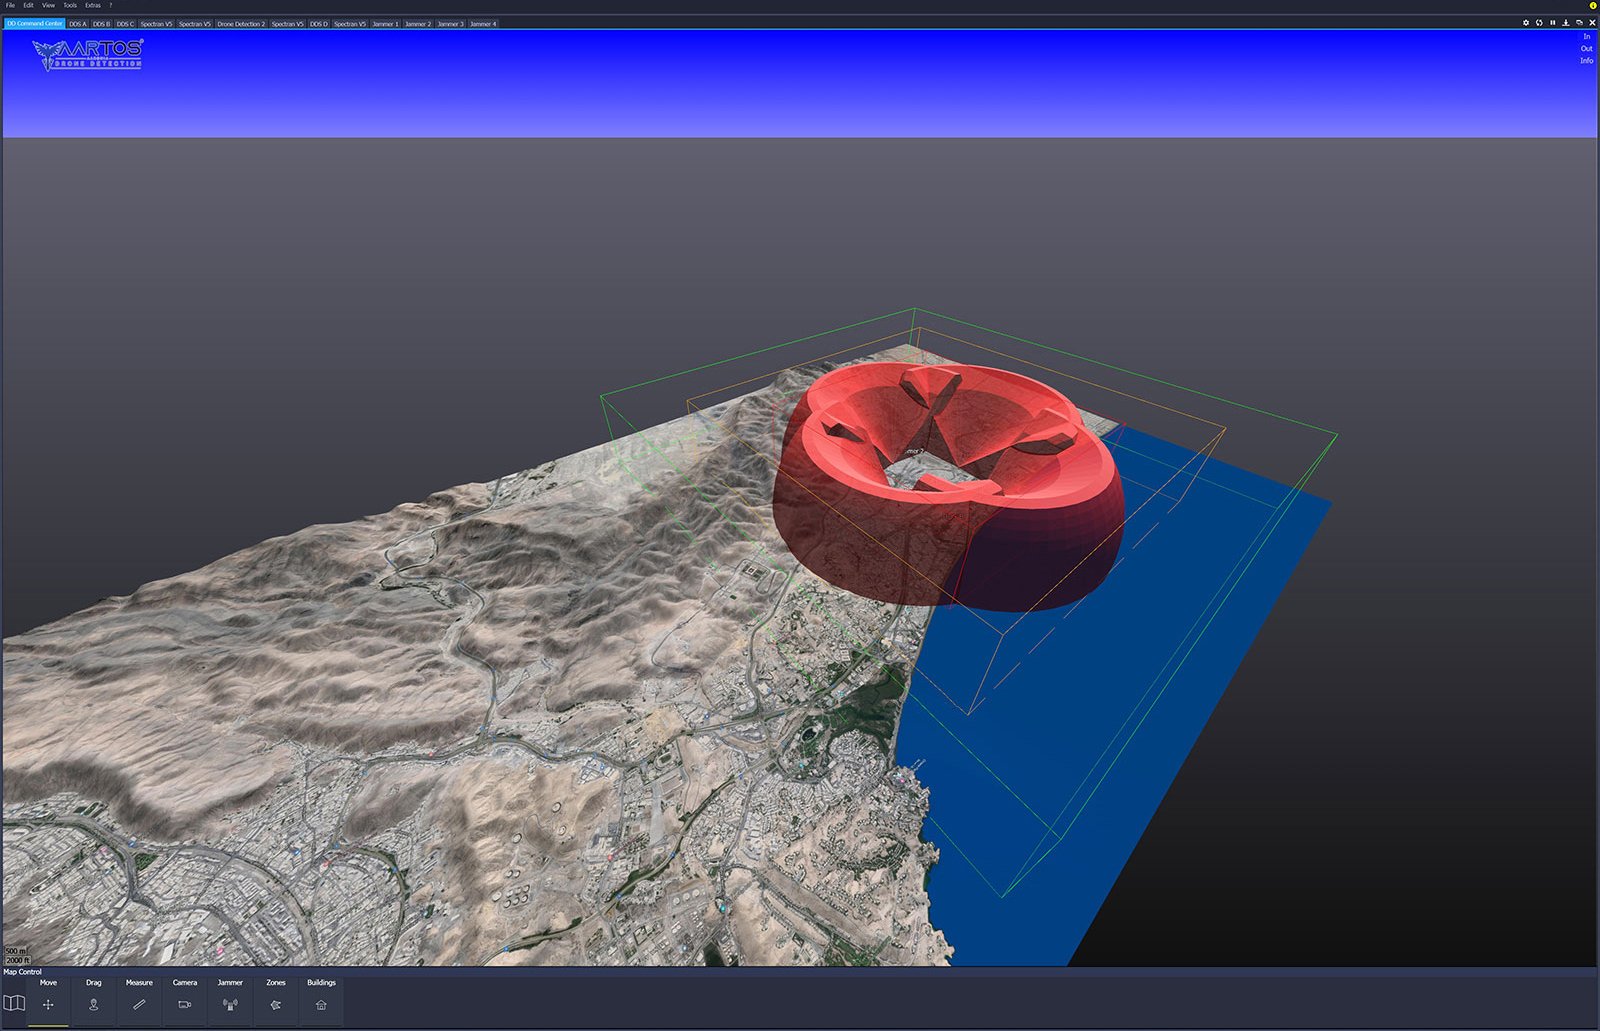
Jammer Setup
The optimal installation of Jammers is a complex challenge, but with the help of our 3D representation, Jammer placement (including height) can be simulated and visualized, even taking topography into account. Each sector or antenna can also be visualized and displayed individually in relation to the frequency. The terrain structure (topography) is also taken into account. Here on the basis of a 4-sector jammer at 2.4 GHz.
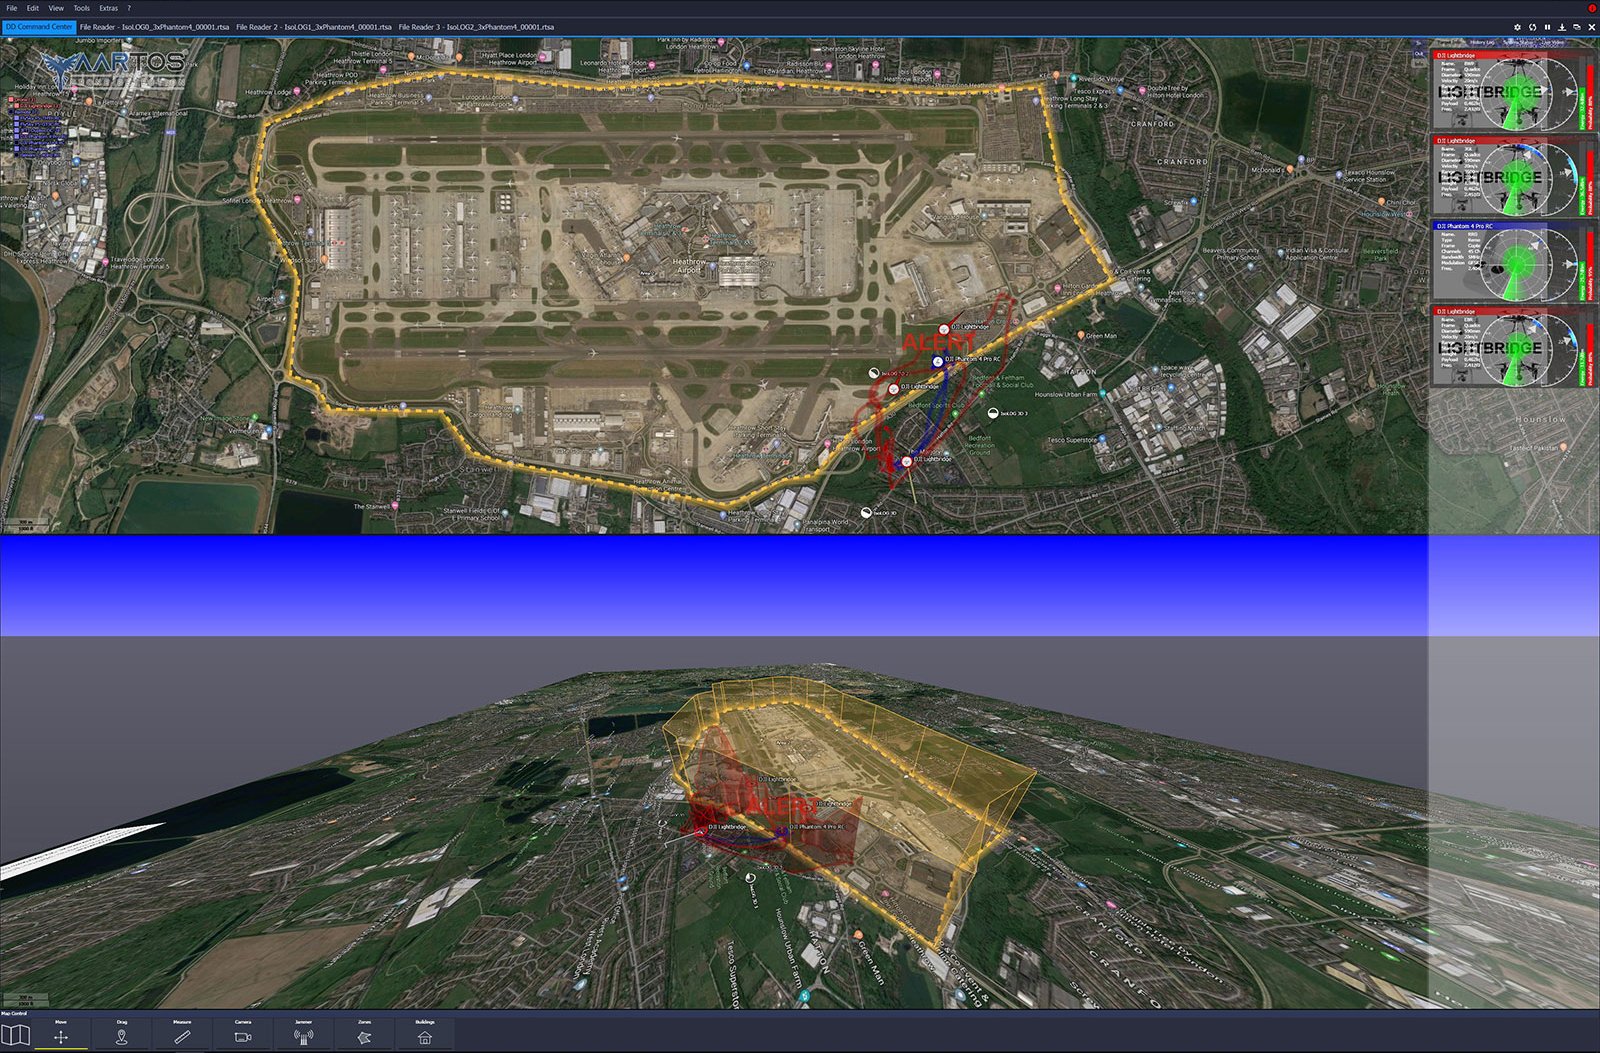
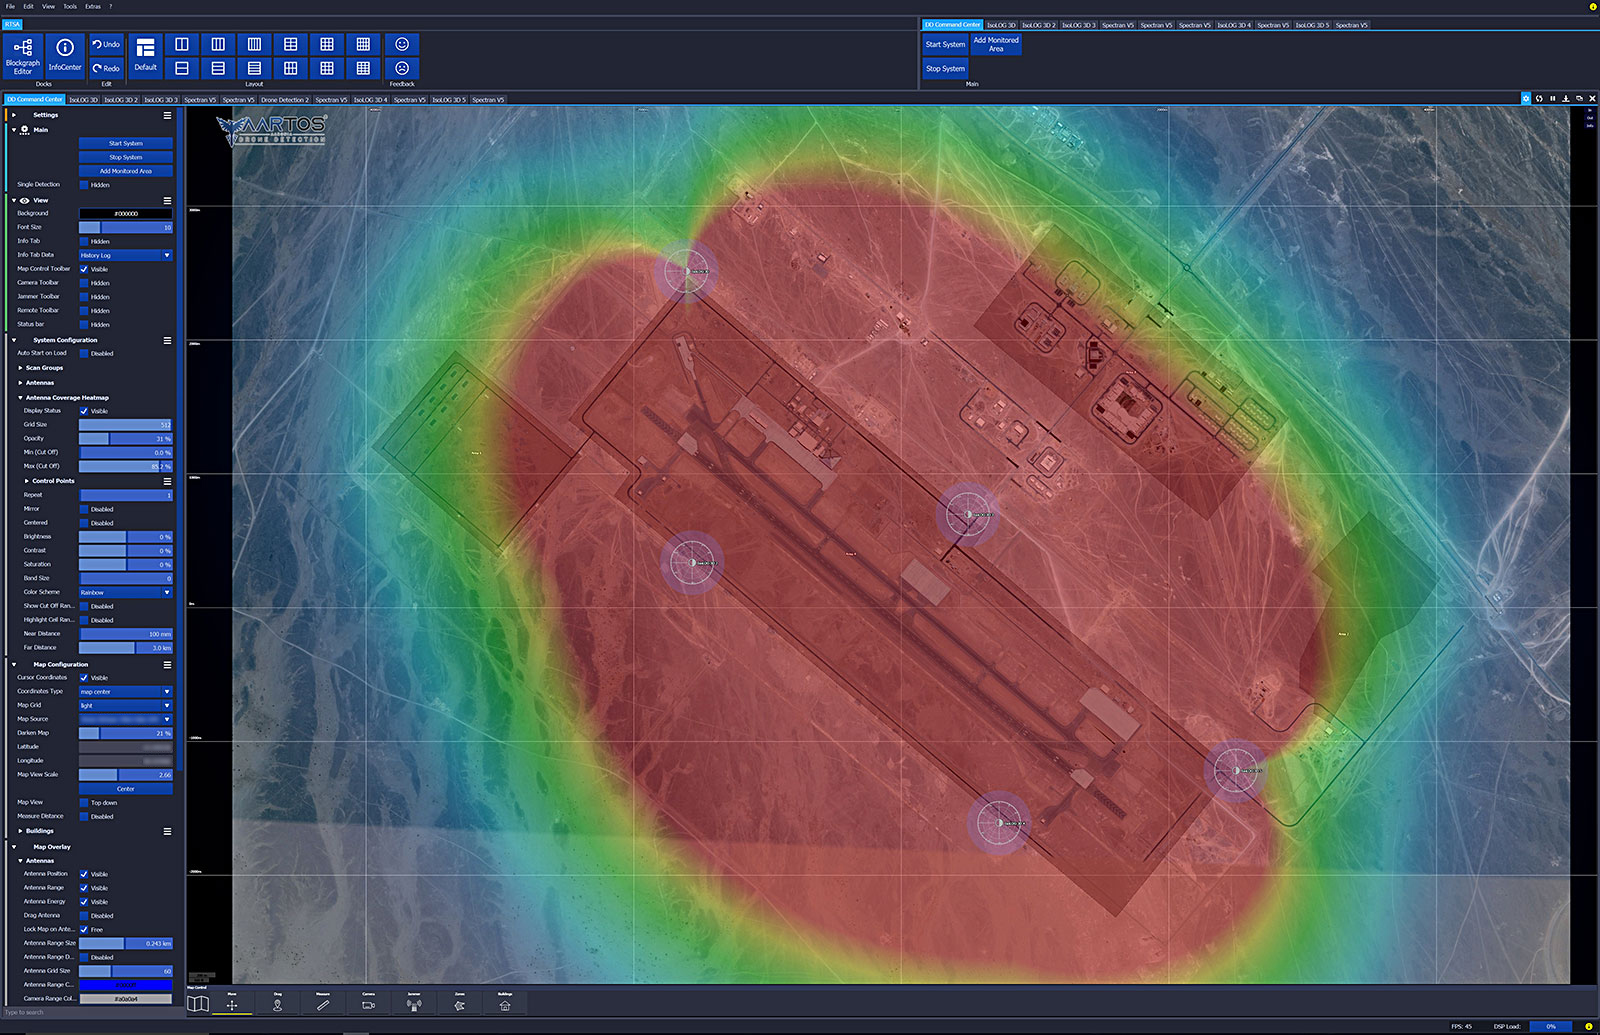
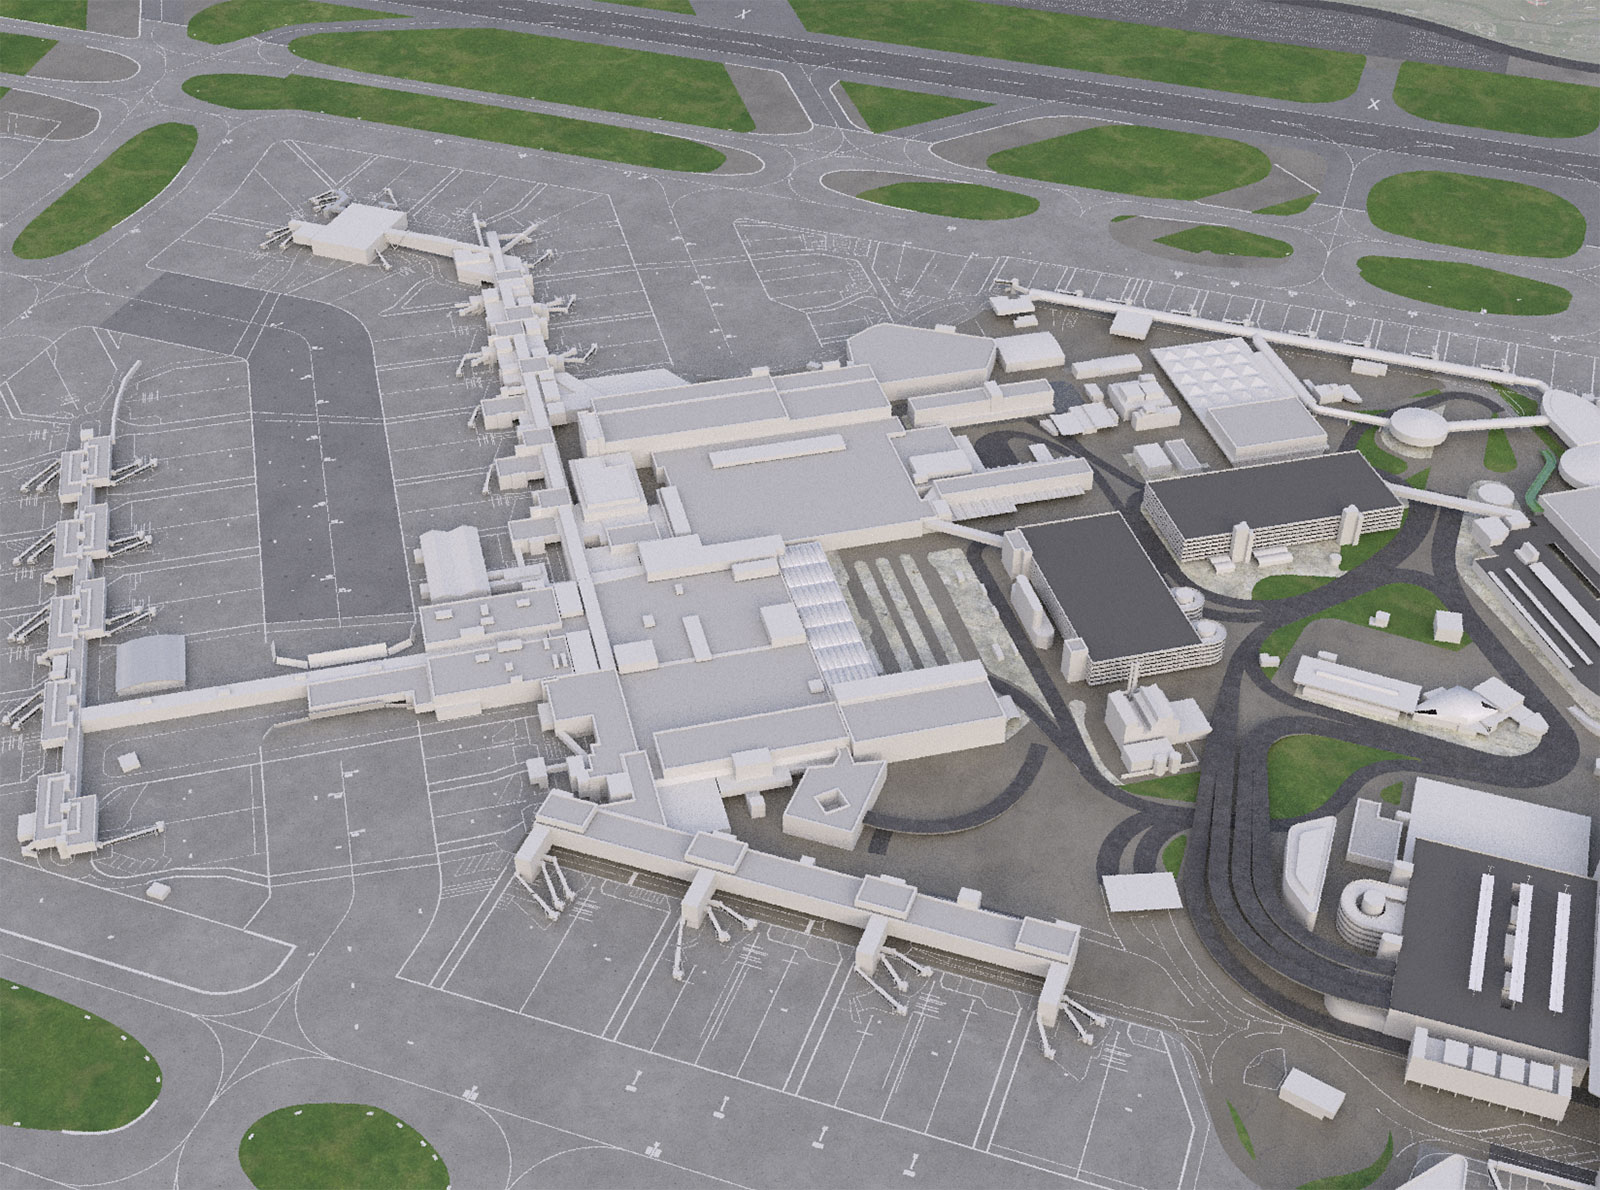
Integration of 3D models
Our latest RTSA-Suite PRO software is now able to integrate even the most complex 3D models (e.g. entire cities, airports, etc.). Creating a very realistic view that considerably improves the usability of the AARTOS™ drone recognition system and is also called the king’s diszplin of visualization and simulation. The first project was the detailed integration of an entire airport including outbuildings and runways in England. The view can be rotated, zoomed and tilted smoothly in all dimensions.
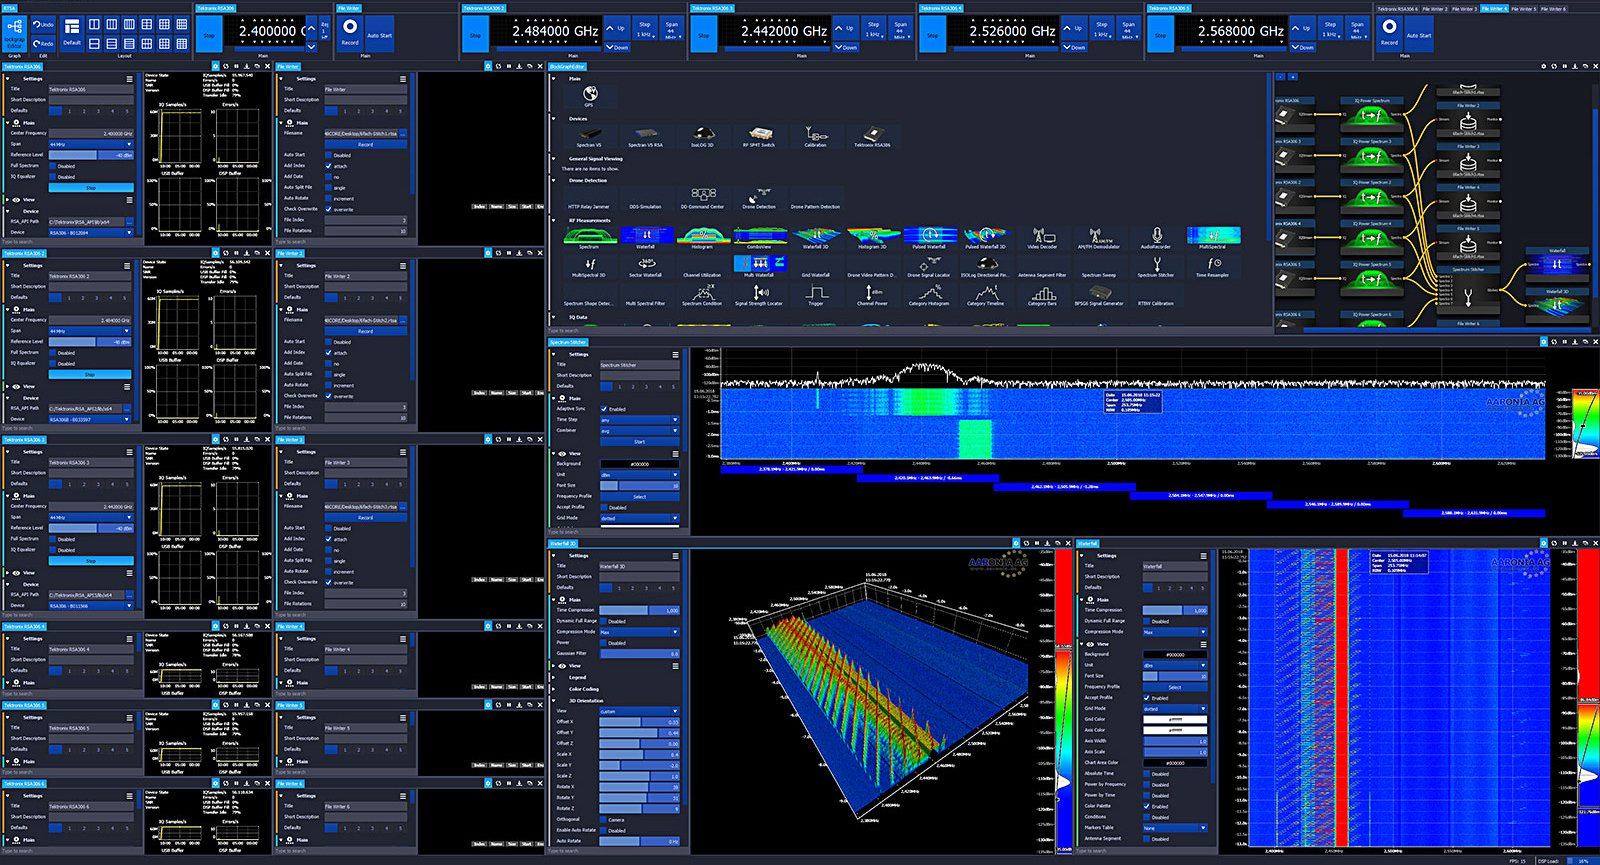
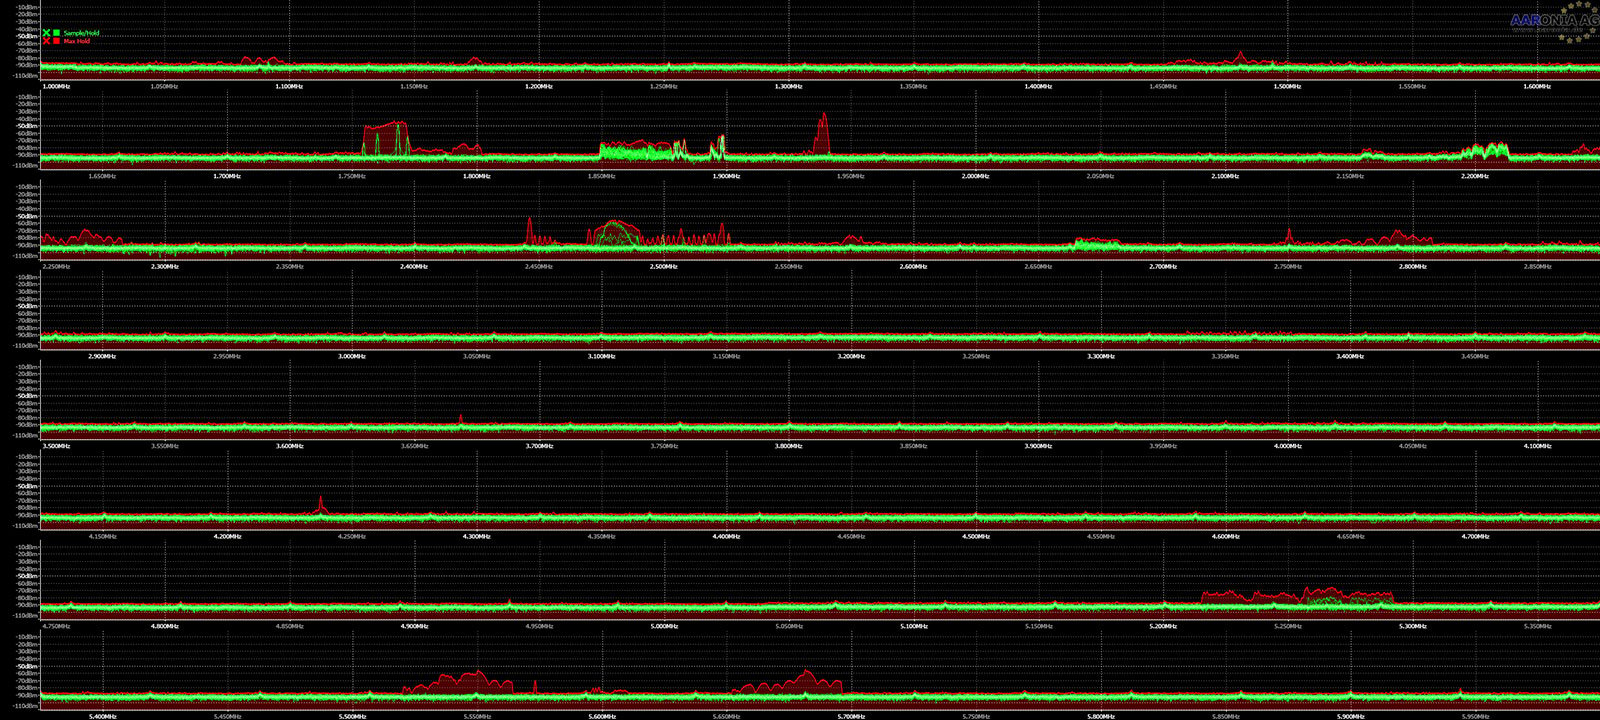
Receiver Stitching
Multiple receivers can be combined into a single device using our software, resulting in a much higher, real-time bandwidth, while still maintaining the sensitivity of the individual receivers. This unique feature enables real-time monitoring over wide frequency ranges. For example, only 4 receivers are required for a frequency range of 1 GHz.
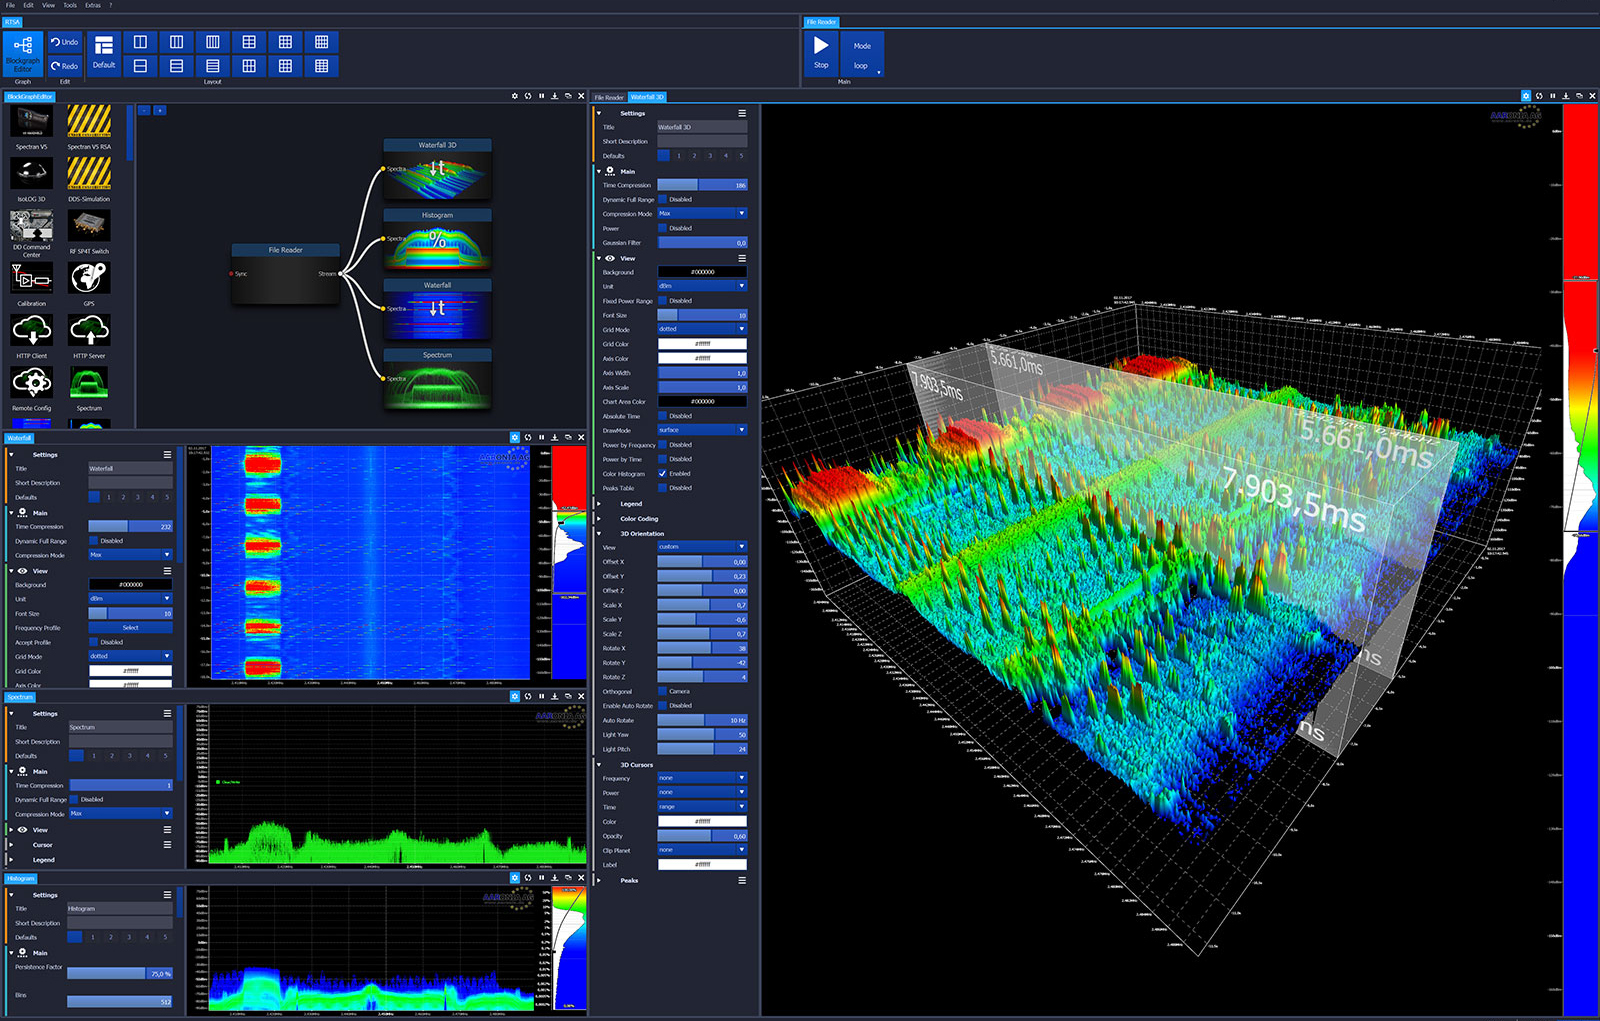
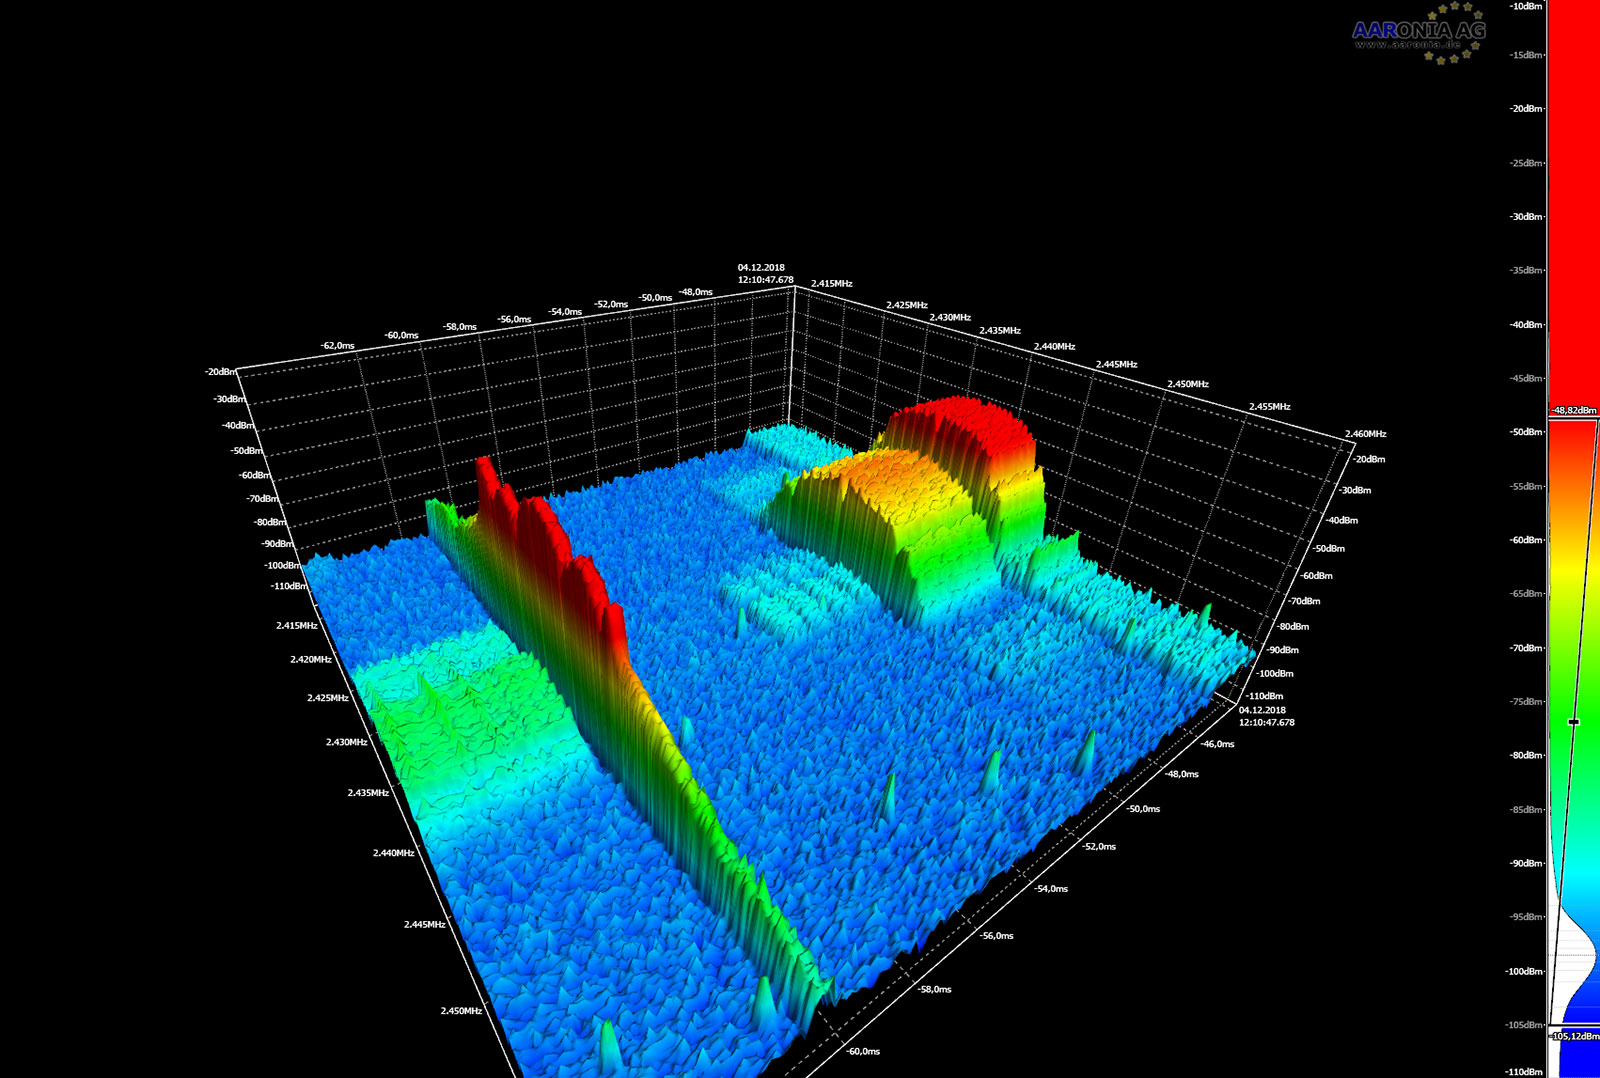
3D Spectrum Analysis
A high-resolution spectrum display with Clear/Write, Min. Hold, Average, reference curves, provider display, limit value curves, adjustable dynamics, as well as freely adjustable colors and resolution (just some features of the almost infinite analysis and display possibilities of our software).
2 THz/s Ultra Wideband Monitoring
Aaronia’s newest product, the V6 receiver, has an unbelievable sweep speed of over 2 THz/s, enabling unprecedented speed in radio monitoring. For example, the entire frequency range up to 6 GHz can be analyzed and measured several hundred times per second. Additionally, this data can be streamed lossless, a UNIQUE feature in the industry that will fundamentally change measurement technology as we know it.